Pollen counts as a % of the season’s peak load of the plant.
Please help your family and friends with allergies by sharing this post with them!
Click on the tree name to see what it looks like!
The S.F. Bay Area Pollen Count Commentary
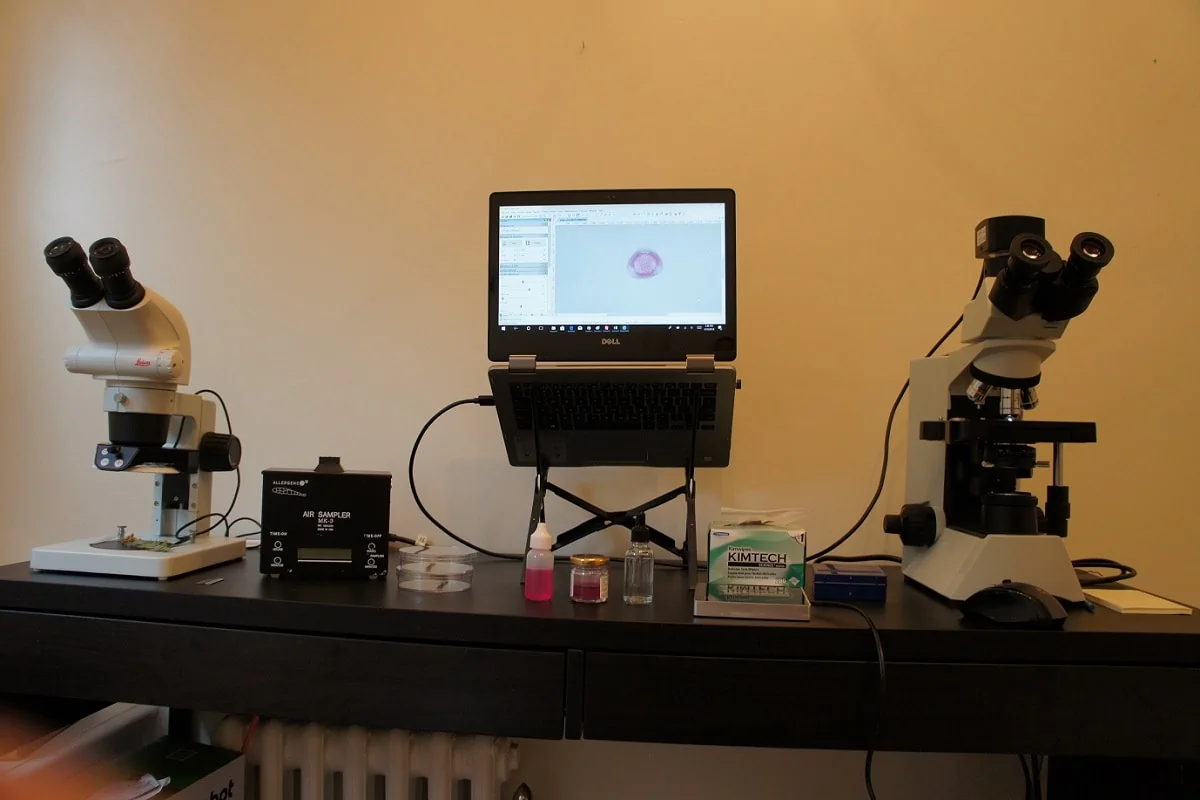
We do regular air sampling and tree inspections throughout the Bay Area for the benefit of the local community.
The Bay Area is home to many native trees like Cypress, Redwoods, Western Sycamore, and California live oaks. All produce an abundance of pollen. However, the major source of allergenic pollen in the region is all imports from the other part of the world.
Many species of alder, birch, elm, casuarina, olive, celtis, privet, and pistache are all non-native to the Bay Area and contribute heavily to the Bay Area pollen count.
Grass pollen season generally starts mid-March and lasts until the end of July.
The weed pollen generally remains low to moderate here. Nettle, sagebrush, dock, pigweed, and English plantain are often seen in our air surveys, albeit in small numbers. In four years of air surveys in the Bay Area, I have never caught ragweed pollen, which leads me to believe that we do not have ragweed in the area.
Our Methodology
We use a combination of air sampling and plant inspections to identify which plants are releasing pollen.
We refrain from using the traditional high, medium, and low classifications because they are rather meaningless for an allergy sufferer. The concentration scales of high-medium-low are designed for academics and not for allergy sufferers. Besides, what is a low count for one person can be very high for someone with strong allergies.
If you are still curious, you can read more about our methodology here.
If an allergen doesn’t appear on this page with its percentage, does that mean it’s not currently releasing pollen into the air? Or does it mean that info isn’t being collected? For instance, I read the oak page but don’t see its percentage here.
I recently found out my child is allergic to oak. Their allergist mentioned the inaccuracy of popular pollen counts and that we don’t have ragweed here, that it’s typically on the east coast. Thank you for collecting this data!
That is correct. I only show pollen counts of plants/trees that are currently in season. If they are not shown on this page, it means those trees are currently dormant.
Various species of oaks in the Bay Area generally bloom between Mar-1 to Jun-30, with some variance year over year.
Wishing your child good health!
Sudhir.
These pollen counts are so incredibly useful 🙂 Do you/would you ever consider posting the historical counts as well?
Hi Kristina – There are reasons why I removed the historical pollen counts from the website. The pollen season has been very different each year for the last four years. While historical counts could be useful in some instances, they could also misinform the users who do not realize the variance in counts from one year to the other. For example, this year not only Sycamore season came nearly 5 weeks late, it was very light compared to 2022. On the other hand Birch season too was late by six weeks, but it was extremely heavy.
I also fear the theft of data, which can then be misused by sites that have mastered the art of search engine optimization to earn advertisement dollars without any actual regard for the health of the readers.
If the historical counts are important to you, please feel free to get in touch with me and I can share it privately.
Sincerely,
Sudhir Setia
Thank you so much for all the great allergy content. I couldn’t find the date for when the pollen count was taken on this page…
Hi Fernando – Thank you for your note! The information on this page relies on air sampling/pollen counts (on average done weekly), visual inspection of the trees (almost daily), and historical data. You can read more on the methodology page under about us.
I see so part of that info is on another page. You might want to consider adding what you just shared about the frequency at the top of this page, so users who might have not read the other page feel more confident about the data they are viewing. It is common to see “last updated” on other pollen count sites so a lot of users might come here and expect the same. If it is missing it might lead to confusion and or a lack of confidence in the results.
The percentage of each pollen count and the information page are my favorite parts of how you chose to display the results.
This is a lengthier discussion than what we can cover in the comments section. I value your feedback and will consider making some changes.
The other sites that you mention generally put in computer-generated data, which is largely inaccurate and is designed only to get advertisement dollars (The exception to this is the NAB/AAAAI sites, which provides data on the basis of actual air sampling). My site is meant to be read as real-time information even though it does not appear so currently. So, your point is well taken.